Vega Charts
on Jekyll
Motivation
As I was working on a Jekyll site for managing some financial data, I realized I would like some charts. I would like to see different debts in relation to each other, sum of debts, income over time, etc.
In this post, we will continue with the Jekyll Collections post by adding a couple charts to the Credit Score example.
For these charts, we will be using Vega Embed.
File Structure
_includes/vega-head.htmlso we aren’t repeating ourselves. If you use charts a lot, you might just include it in your site header._includes/all-credit.jsonwhich will aggregate all our vendors into a single json blob._includes/chart-records.htmlwhich will chart all of the supplied records._includes/chart-avg.htmlwhich will chart the average score of the supplied records._includes/chart-combined.htmlwhich will chart all of the supplied vendors.- Our existing
_layouts/credit.htmlto be updated with the chart. - Our existing
pages/credit.htmlto also be updated with charts.
_includes/vega-head.html
This file provides the common javascript headers needed to display a chart. You could embed this directly in the chart-* files, but we would have to duplicate it 3 times. You could also embed it in your site headers, but then all pages get the overhead.
<script src="https://cdn.jsdelivr.net/npm/vega@4.2.0"></script>
<script src="https://cdn.jsdelivr.net/npm/vega-lite@3.0.0-rc4"></script>
<script src="https://cdn.jsdelivr.net/npm/vega-embed@3.18.2"></script>

<style media="screen">
  /* Add space between vega-embed links  */
  .vega-actions a {
    margin-right: 15px;
  }
</style>
Without the style change, the links at the bottom of the image touch each other and look really bad.
_includes/all-credit.json
With this file, we are just going to loop over the data and generate a json file. It is important to note that the json file is actually written in Liquid syntax and has no Front Matter.
[
  {% for credit in site.credit %}{% for record in credit.records%}
    {"source":"{{credit.title}}", "date":"{{record.date}}", "score":{{record.score}} },
  {% endfor %}{% endfor %}
]
Each collection we create can be referenced by site.name. The record array within that collection refers to an individual file we created, for example TransUnion.md. So, a single record is just a single set of properties in that array (in this case date and score).
What we are doing here is adding a source attribute so that all TransUnion entries will be associated with each other. This allows Vega to show multiple lines on the same chart.
_includes/chart-records.html
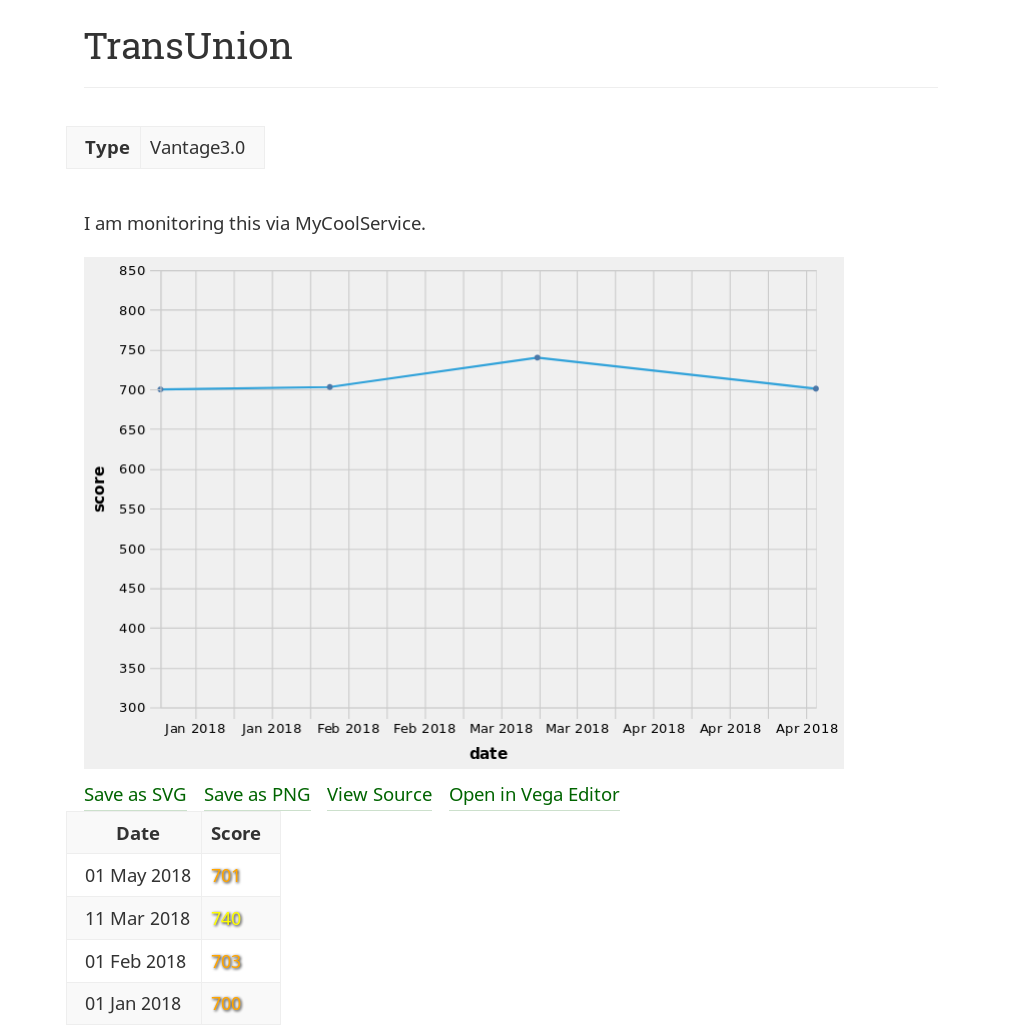
This is where it gets a little more complicated, but not too bad. Remember this is for a single vendor, like TransUnion.
{% include vega-head.html %}

{% assign sorted = page.records | sort:include.y %}
{% assign minAmt = sorted.first[include.y] %}
{% if include.min %}
  {% assign minAmt = include.min %}
{% endif %}
{% assign maxAmt = sorted.last[include.y] %}
{% if include.max %}
  {% assign maxAmt = include.max %}
{% endif %}

<div id="{{include.name}}"></div>
<script type="text/javascript">
    var yourVlSpec = {
  "$schema": "https://vega.github.io/schema/vega-lite/v2.json",
  "description": "{{ page.title }}",
  "data": {
    "values": {{ page.records | jsonify }}
  },
  "mark": {"type": "line", "line": true, "point": true},
  "encoding": {
    "x": {
	"field": "date",
	"type": "temporal",
	"axis": {"format": "%b %Y"}
    },
    "y": {
	"field": "{{ include.y }}",
	"type": "quantitative",
	"scale": {"domain": [{{minAmt}},{{maxAmt}}]}
    }
  },
  "width": 600,
  "height": 400
};
    vegaEmbed("#{{ include.name }}", yourVlSpec, {theme: 'fivethirtyeight'}).catch(console.warn);
</script>
Going through this, you will notice a few things.
- We include the vega-head.html that we created above.
- We sort the records based on
include.y. We’ll look at this later, but what it means is theyparameter that was passed in. This is to allow the chart to be reusable. - We grab the lowest and highest records from the sorted list to give us our min and max IF they were not passed in.
- The Vega website will use names like ‘vis’ for the div. We are not doing that because we are potentially embedding more than one chart on the same page. As such, we are using a name that was passed in.
- For the data values, we are converting our collection records using
jsonify. This is because we are only looking at one vendor at the moment. - We are labeling the x axis with month and year.
- We are labeling the y axis with the record values, between the min and max amounts above – based on whatever
yfield was specified. - We are setting a specific height and width that look nice. Since the Jekyll site is set to 600 width for all images, that works well for the charts too. It should be noted that those with legends will be slightly larger.
_includes/chart-avg.html
If you don’t care about making the charts re-usable, they can be quite a bit simpler. For example, this chart will show the average of your credit scores across all vendors – but assumes a domain scale based on the possible credit score values.
{% include vega-head.html %}

<div id="{{include.name}}"></div>
<script type="text/javascript">
    var yourVlSpec = {
  "$schema": "https://vega.github.io/schema/vega-lite/v2.json",
  "description": "{{ page.title }}",
  "data": {
    "values": {% include {{include.data}}.json %}
  },
  "mark": {"type": "line", "line": true, "point": true},
  "encoding": {
    "x": {"field": "date", "type": "temporal", "axis": {"format": "%b %Y"}},
    "y": {"field": "score", "type": "quantitative", "aggregate": "average", "scale": {"domain": [300,850]}}
  },
  "width": 600,
  "height": 400
};
    vegaEmbed("#{{ include.name }}", yourVlSpec, {theme: 'fivethirtyeight'}).catch(console.warn);
</script>
The only two things of note here, compared to the last one, are the data values and the y aggregation.
The data values will take the partial filename that you pass in and load that as a json blob.
_includes/chart-combined.html
The combined chart is a little different. It will show each vendor on the chart as a separate line. This can be useful for comparing them to each other.
{% include vega-head.html %}

<div id="{{include.name}}"></div>
<script type="text/javascript">
    var yourVlSpec = {
  "$schema": "https://vega.github.io/schema/vega-lite/v2.json",
  "description": "{{ page.title }}",
  "data": {
    "values": {% include {{include.data}}.json %}
  },
  "mark": {"type": "line", "line": true, "point": true},
  "encoding": {
    "x": {"field": "date", "type": "temporal", "axis": {"format": "%b %Y"}},
    "y": {"field": "{{ include.y }}", "type": "quantitative"},
    "color": {"field": "{{ include.color}}", "type":"nominal" }
  },
  "width": 600,
  "height": 400
};
    vegaEmbed("#{{ include.name }}", yourVlSpec, {theme: 'fivethirtyeight'}).catch(console.warn);
</script>
It loads data the same way as the last one, does not do the aggregation or the domain, but does include a color. We’ll get into what that means in a minute.
Our existing _layouts/credit.html
We’re going to update this page to include a chart. It’s a simple one-line change.
---
layout: default
---

<article class="credit">

<table>
  <tr><th>Type</th><td>{{page.type}}</td></tr>
</table>

<div>
{{content}}
</div>

{% include chart-records.html name="records" y="score" min=300 max=850 %}

<table>
  <tr><th>Date</th><th>Score</th></tr>
{% for record in page.records reversed %}
<tr>
  <td>{{ record.date | date:"%d %b %Y" }}</td>
  <td>{% include credit_score.html record=record %}</td>
</tr>
{% endfor %}
</table>

</article>
We specify that we want to show the chart-records chart, that the name (used for the div for example) should be ‘records’, that the y field should be bound to the score field inside the record array, and we are pre-populating the min and max values based on our knowledge of credit scores.
Our existing pages/credit.html
On the index page, we will add two more charts. Each one is a 1-line change.
---
layout: page
title: "Credit Scores"
permalink: "/credit/"
menu: true
---

{% include chart-avg.html name="avg" data="all-credit" y="score" %}

{% include chart-combined.html name="combined" data="all-credit" y="score" color="source"  %}

<ul>
{% assign sources = site.credit | sort: 'title' %}
	{% for credit in sources %}
	<li>
{% assign record = credit.records.last %}
		<a href="{{ credit.url }}">{{ credit.title }}</a> - Current Score: {% include credit_score.html record=record %}</li>
	{% endfor %}
</ul>
The first one, the chart-avg specifies to use our all-credit.json file we created, and ties the y field to the score field of the record.
The second one does similar, but specifies that the color field should be bound to the auto-generated source field in the all-credit.json. This allows all data points of the same vendor to be the same color. This will also generate a legend.
Note that the two charts have different names so that they don’t conflict.
Final Thought
I’ll try to get some mock data put together like I did for the initial image and add some more images to this post.